
Updated: 10/12/2016
Developing Solution: Dashboard
Experiment 1
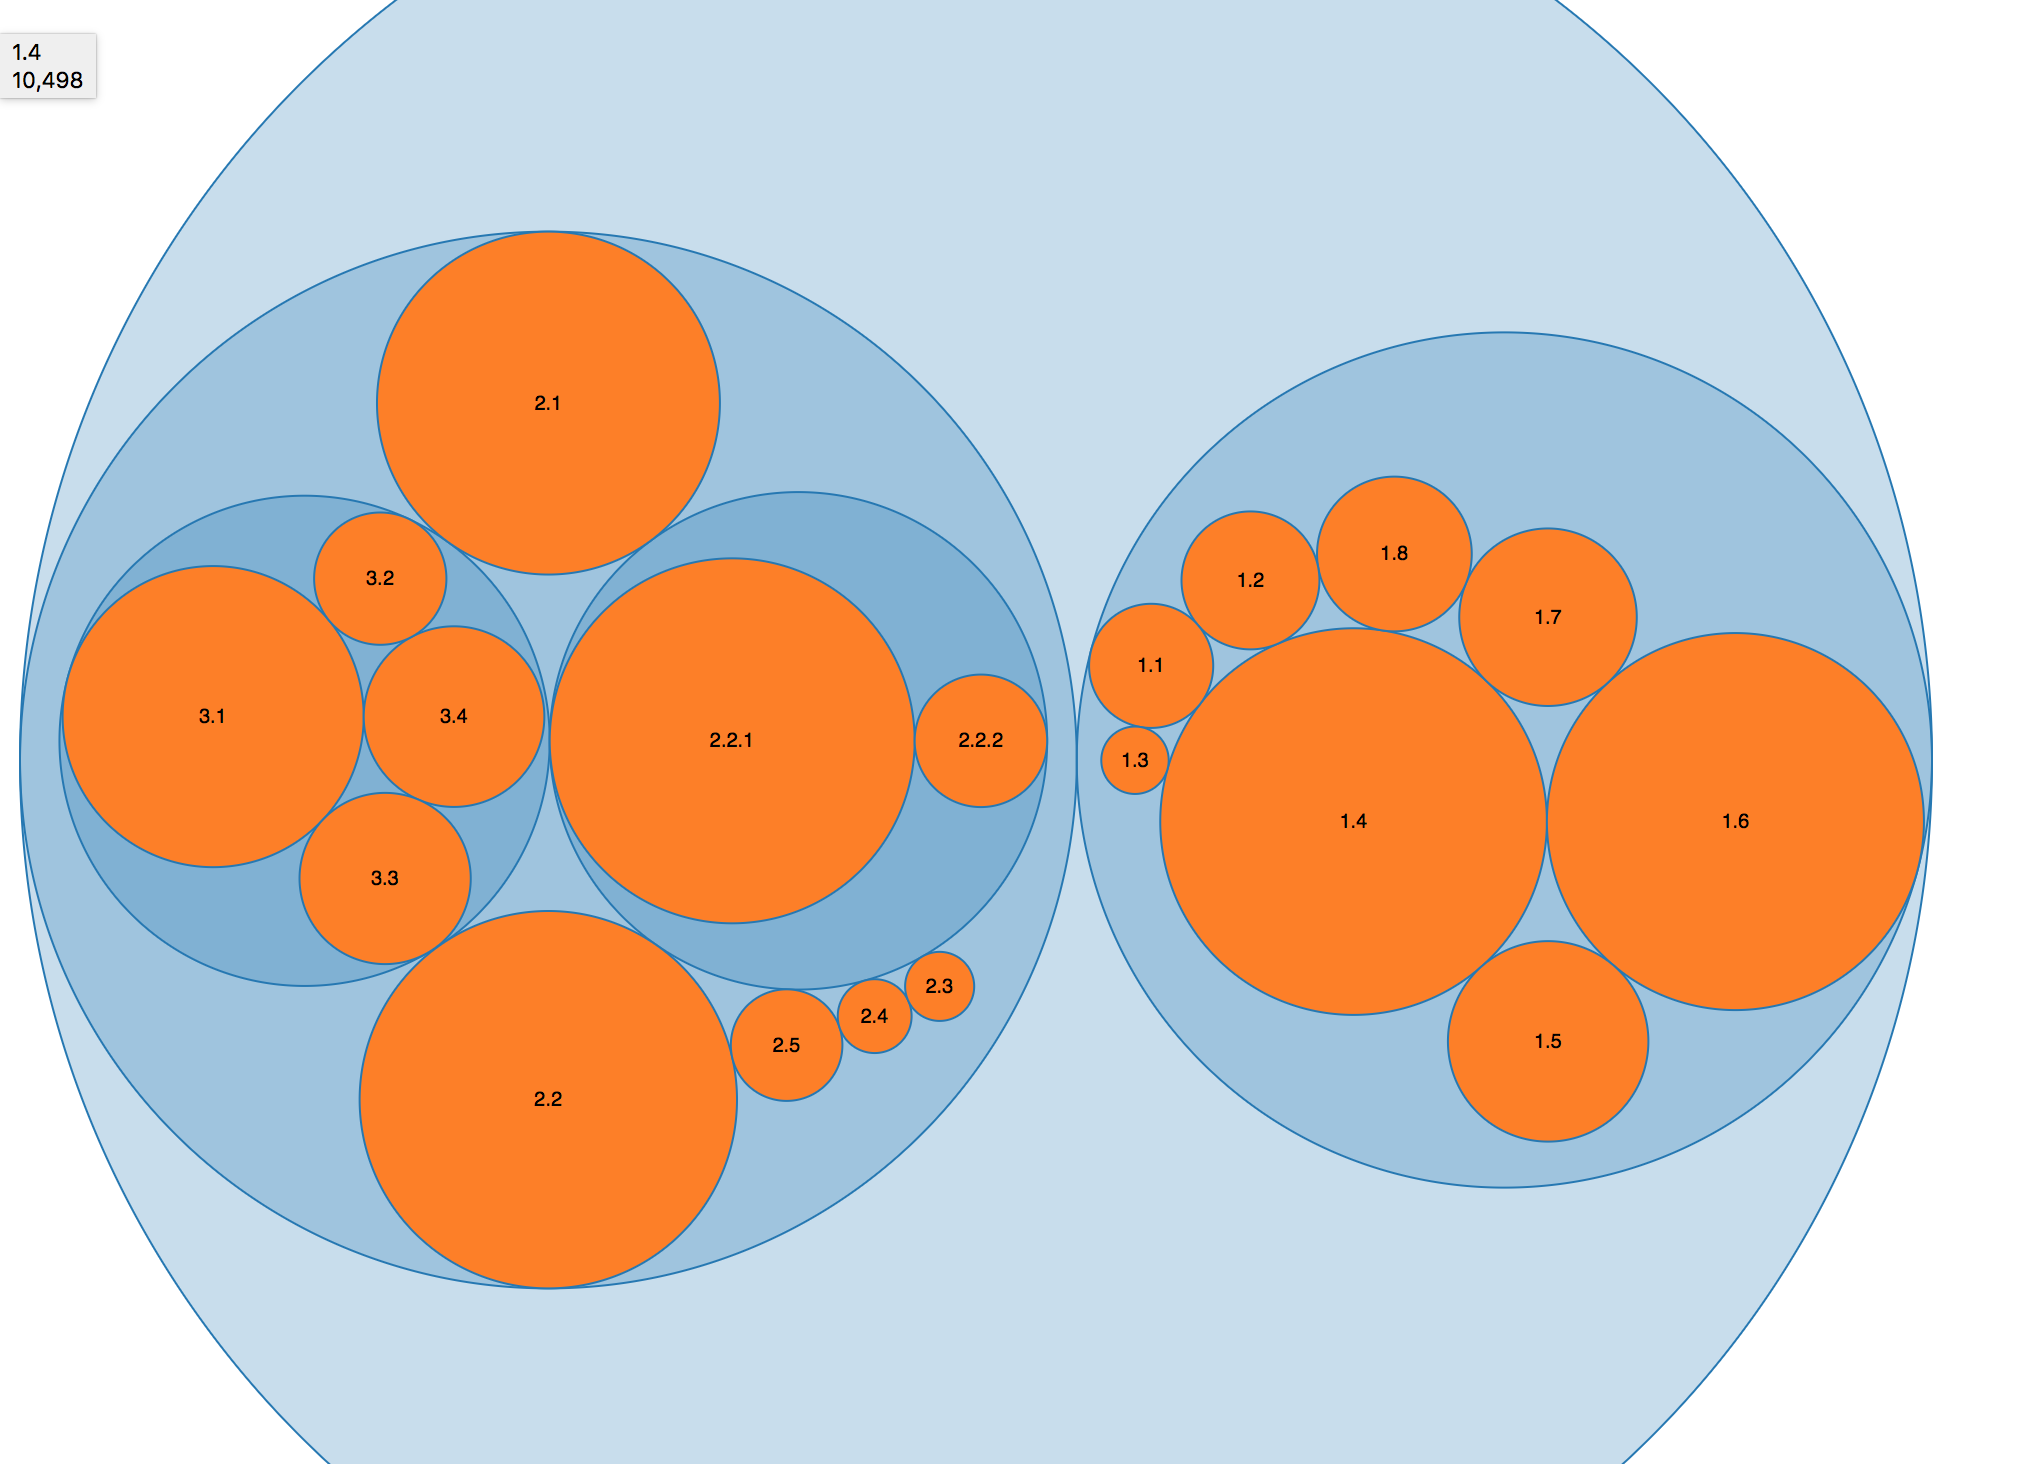
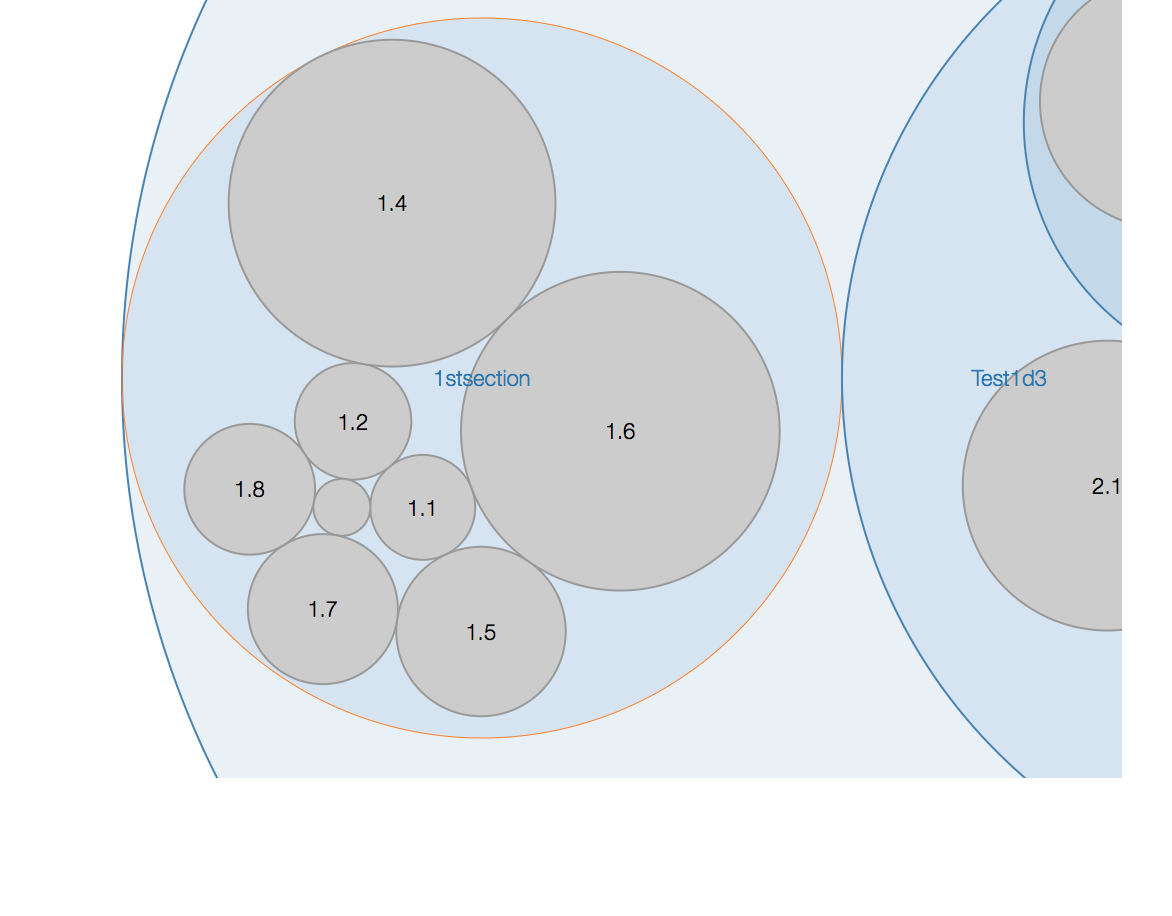
In this experiment we took a preliminary look at how d3 could be used for data visualisation. We created a static chart displaying a multi-hierarchical structure, and explored the customisability of D3. Follow this link to access live demo: click here.
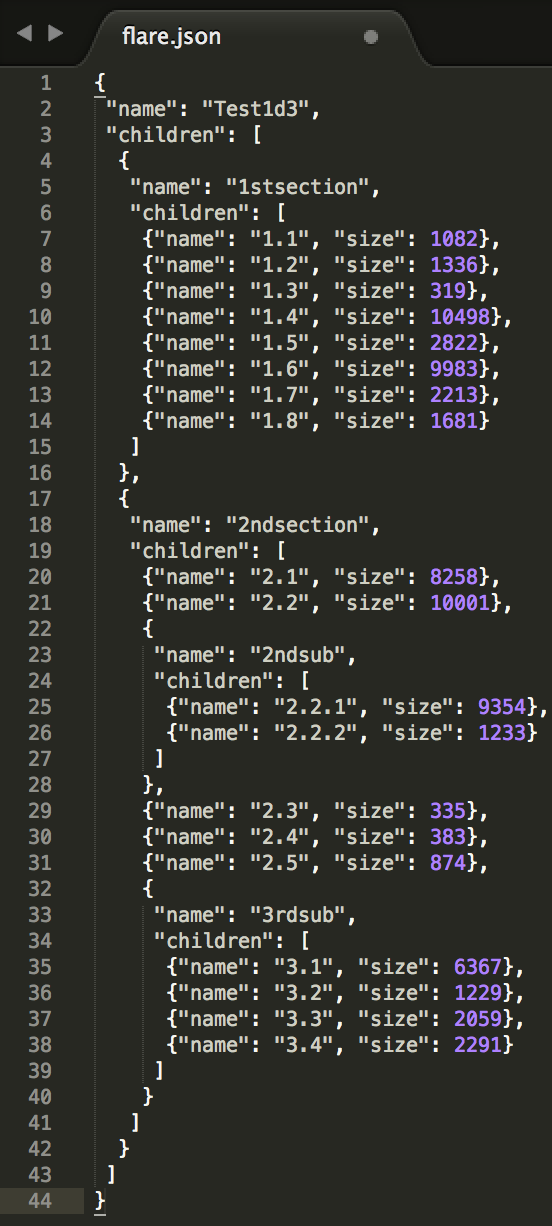
Experiment JSON (layout of hierarchy):
Result:
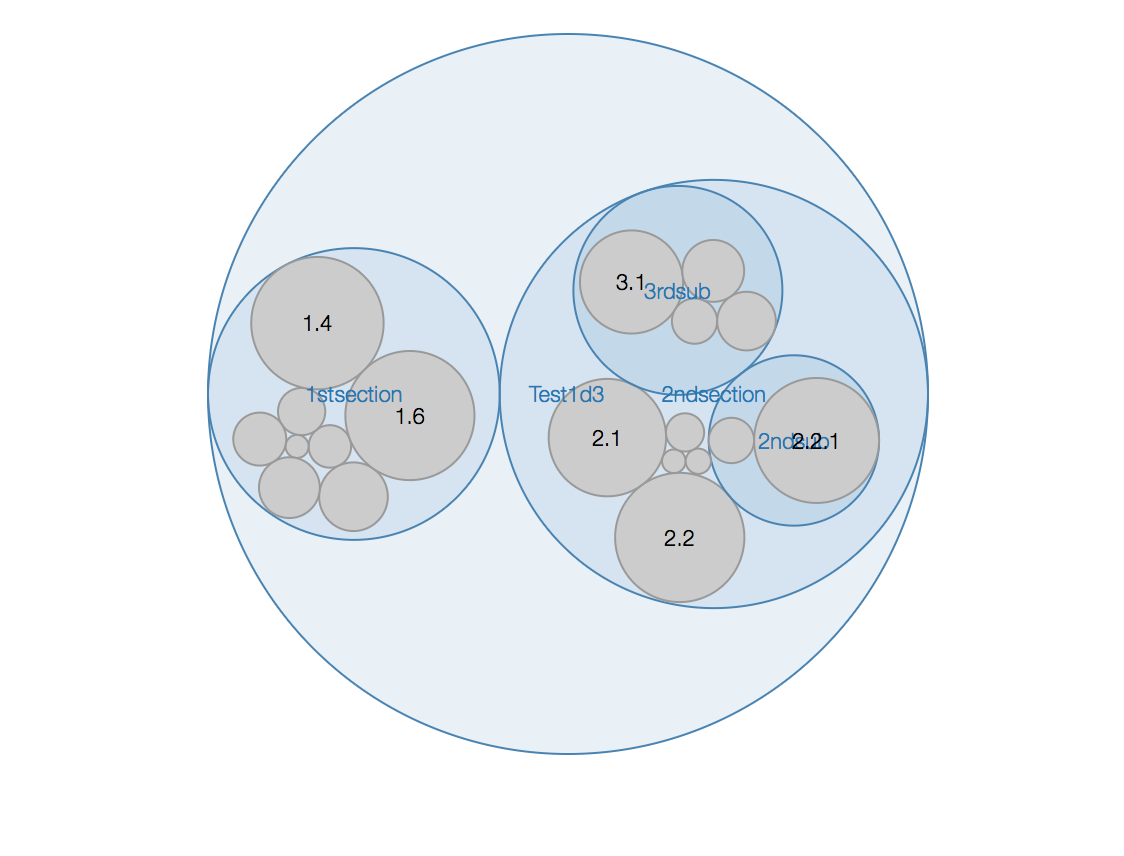
Experiment 2
Here we built upon experiment 1, using a similar hierarchical layout and added interactivity. Follow this link to access live demo: click here.
Click on any picture to expand.
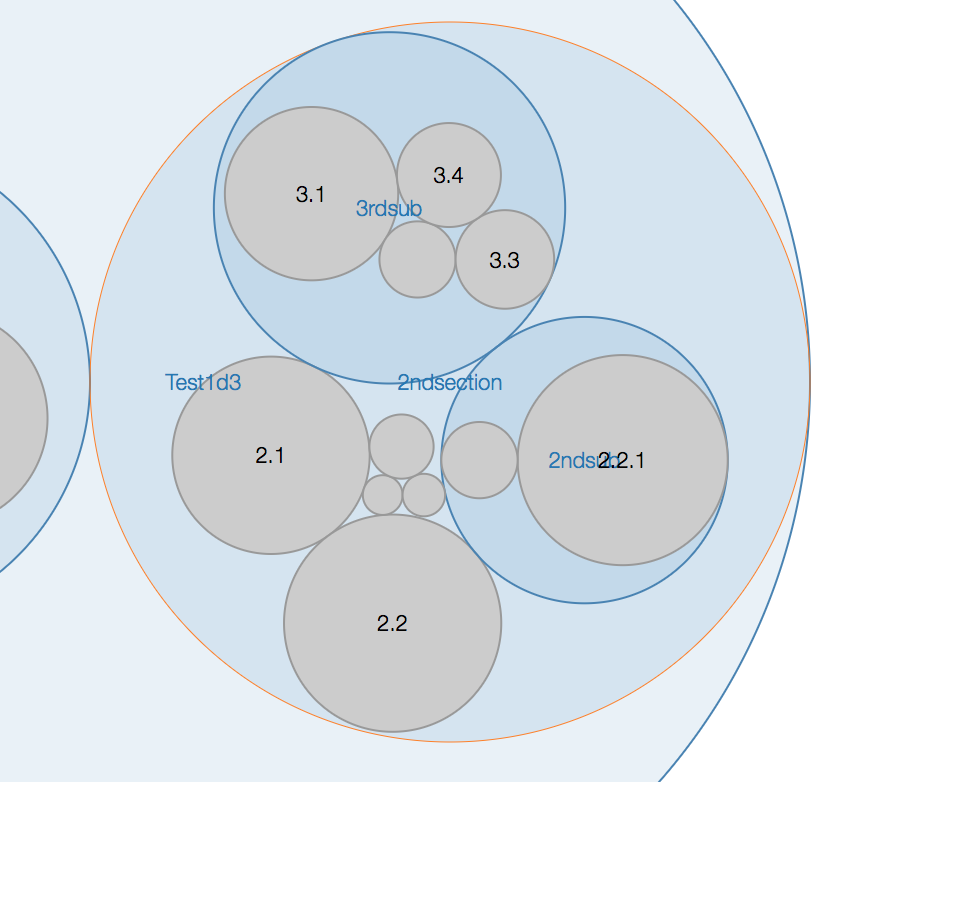
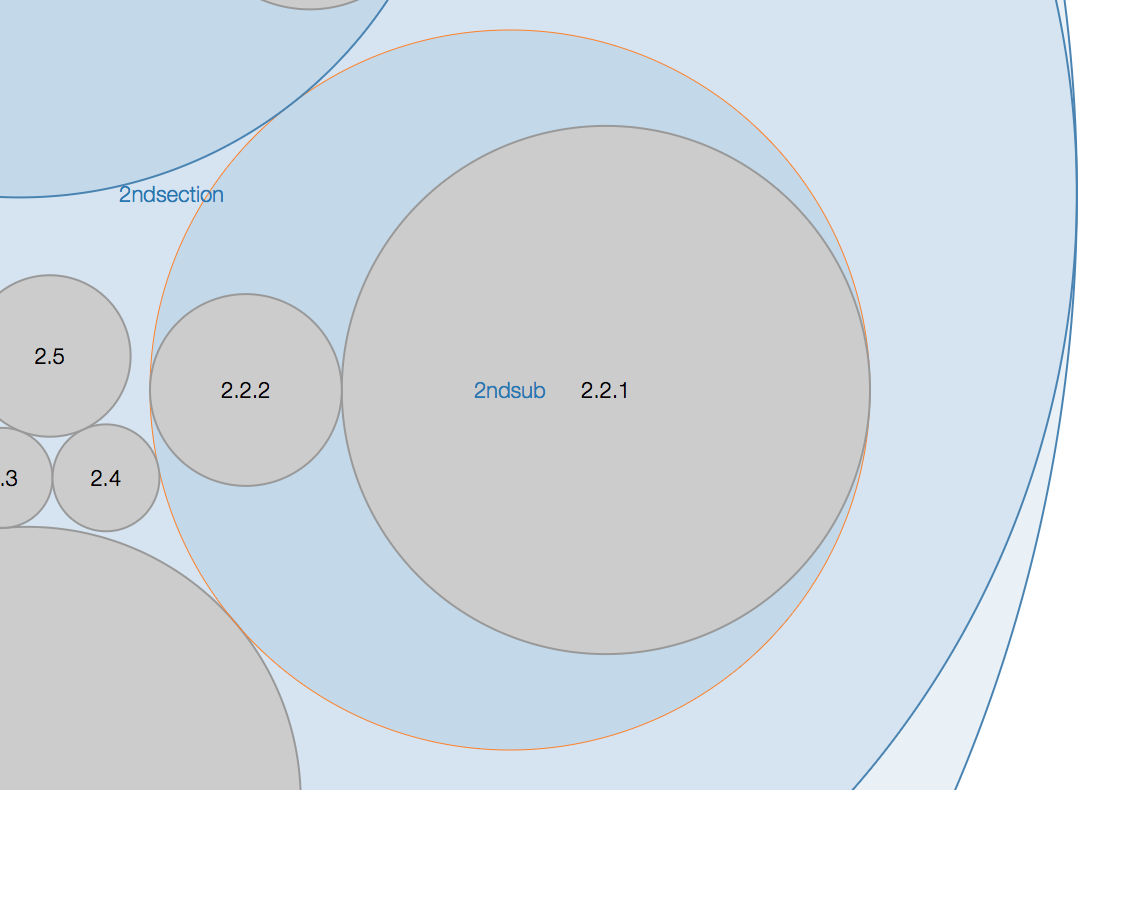
Expanded View